Published
- 15 min read
Debugging QGIS C++ from inside container using Visual Studio Code
Why do you even need to compile C++ code from inside a docker container? Even more so, why do you go to such length to debug it? Things will be easier if you can just compile natively…
Well like every good story, there are reasons to do that and I would be very happy to rant it to you. But for those who are not interested and to see how that is technically possible, just skip to How.
For those who wants to hear the reason, well, bear with me :D
Intro
It all started when I was trying to port my old Python app from Python 2 to 3. I saw that there are some weird unit tests that failed in a certain QGIS version, almost consistently. However, it doesn’t print any useful error logs or stacktrace. That means the app crashed before it began testing something.
This is the problematic output taken from Travis CI:
       Test saving Current scenario. ... skipped 'Skip when running on Travis'

test_validate_input (gui.tools.test.test_save_scenario.SaveScenarioTest)

Test validate input. ... skipped 'Skip when running on Travis'

test_analysis_wizard (gui.tools.wizard.test.test_function_centric_wizard.TestImpactFunctionCentricWizard)

Test Analysis Wizard. ... Warning: QSvgHandler: Image filename is empty

QGIS died on signal 11QGIS died on signal 11

Finished running test test_suite.test_package (codes: IS_DEAD=0 IS_FAILED=1 IS_PASSED=1).

The command "docker-compose exec qgis-testing-environment qgis_testrunner.sh test_suite.test_package" exited with 1.
As you can see there, QGIS just died without printing anything…
Before I go deep. Let me explain about the environment. QGIS is a desktop application for GIS (Geographic Information Systems), built in C++ using Qt Framework. QGIS has two flavor of API, which is QGIS C++ API and PyQGIS (QGIS API wrapped in Python). My Python application is a plugin in QGIS that uses PyQGIS API. PyQGIS itself is mostly just a wrapper. It will call the actual function written in C++. In Travis CI, my unittests were run from inside QGIS containers. In the past we built our own docker image, but now QGIS has it’s own official image and equipped with scripts to run unittests in QGIS context.
In my current context, things are happening somewhere deep inside the function that calls PyQGIS API then it just crashed. Before I went to debug the C++ code, of course my first attempt were to just track the python side of things. I mainly use PyCharm if I need python debugger. I systematically follow and track which line where the program crashed, then finally I arrived at the statement layer.commitChanges() which I can’t debug anymore because it is a QGIS object wrapped in python.
So my choice were only to figure out what happened in the C++ code. The statement doesn’t tell anything because it is doing internal process (no input or output).
However I’m reluctant with compiling QGIS code. Not because I don’t know C++, but, compiling huge codebase like QGIS might take literally hours if done in my poor laptop. I don’t want to do that just for tracking my app. I didn’t intend to do some modification on the QGIS code, I just want to see the code flow and do some inspections about the internal data.
One other barrier to notice is because I have my own QGIS copy in my machine. If I want to build from source, I need to track my dependencies to follow the documentations. That is sincerely troublesome for me.
To solve that, I was thinking that maybe I would just built an image in Debug mode. Dockerhub will built it for me, their infra probably are much powerful. Then I can just download it, extract the cache or binaries, then just debug it from inside the container. That sounds reasonable.
Since I’m using QGIS official image to run the unittests, the first thing that I check is wether the image already has compiled cache. It turns out there is! I was quite surprised at first, because I thought they will make the image slim. However, they don’t have debug binaries or debug-mode container.
That leave me with no choice to try to build the image my self. Using official QGIS image, I set out to extend it to include debugging tools. I would rather download a 2 GB image and waiting for it to finish in 20 minutes rather than making my machine compiling for several hours and block my other work.
How
Now the fun part, I will explain step-by-step my reasoning to reproduce.
I dump the resources in my repo here: https://github.com/lucernae/qgis-debug-mode/
The general ideas are like this:
- Create Dockerfile recipe using existing QGIS official image
- Build the image using Docker Hub
- Pull the image
- Run the containers
- Extract caches, binaries, headers from the containers
- Rerun container for debug mode, this time mounting my host volume inside
- Run remote debugger server inside the container
- Connect from my host machine using Visual Studio Code remote debugging and source code map
- Trace the code
We are going to iterate one by one.
Create Debug-mode image
You need to consider what kind of abilities you want the container to have. For me:
- Ability to change the CMAKE Flags (so I can switch it to Debug mode build).
- Include SSH Server, in case I need it to rsync or access the container using VSCode or PyCharm tools
- Include VNC server, in case I want to see visual GUI feedback when the unittest is running
- Add entrypoint script injection, in case I need to do preparation step before debugging session (like installing some binaries, etc).
You can check the final recipe here: https://github.com/lucernae/qgis-debug-mode/blob/master/Dockerfile
Build the image using Docker Hub
This one is pretty simple. You go to the docker hub: https://hub.docker.com/
Create a new repo, then link it with your github repositories that contains the recipe. You can then trigger build from there. I think there are many articles that describes this step
Pulling the image
Once your image is built. Pull it in your machine like this:
docker pull lucernae/qgis-debug-mode
Replace lucernae with your docker hub username.
Replace qgis-debug-mode with your docker image repo name.
If no tag is specified, it will take the latest tag.
Run the containers and extract caches
Basically, you need a running containers if you want to copy the files inside it to your host. The script https://github.com/lucernae/qgis-debug-mode/blob/master/scripts/sync-cache.sh does just that.
There are 3 directories that I think is important. You can decide if you want to extract it or not.
build directories
Inside the containers, it is located in /QGIS/build. This is where the cmake config and the build output is located.
ccache directories
Inside the containers, it is located in /QGIS/.ccache_image_build. You might want to store it if you want to do a recompilation and save time doing that.
development headers
This is especially important since I want to debug the code, I need the C++ dev headers. This is because I don’t want to install the header inside my machine. The headers, as usual, is located in /usr/include. I copied it into my host’s build directory.
Running containers with persistence
After I extracted those 3 directories, I rerun the container with those directories mounted. This is because I want to keep the state, separated from the containers. If I need a recompile, then the changes will be persisted.
The final docker-compose.override.yml in my case is:
       version: '3'
services:
  qgis:
    image: lucernae/qgis-debug-mode
    command: /bin/bash -c "while [ 'TRUE' ]; do gdbserver 0.0.0.0:34567 /QGIS/build/output/bin/qgis; done"
    ports:
      - '34567:34567'
      - '322:22'
    environment:
      DISPLAY: ':98'
    volumes:
      - /home/lucernae/WorkingDir/QGIS/QGIS/.ccache_image_build:/QGIS/.ccache_image_build
      - /home/lucernae/WorkingDir/QGIS/QGIS/build:/QGIS/build
      - /home/lucernae/WorkingDir/QGIS/QGIS/src:/QGIS/src
      - ${PWD}/user_scripts/my_startup.sh:/docker-entrypoint-scripts.d/my_startup.sh
      - ${PWD}/user_scripts:/user_scripts
      # InaSAFE
      - /home/lucernae/WorkingDir/InaSAFE/inasafe:/tests_directory
As you can guess from the recipe:
- I ran gdbserver in a loop in port 34567. Whenever my session ended, gdbserver will be ready again.
- I expose the ssh port into port 322, and the debug server to 34567
- I used
DISPLAY: ":98"which is where the VNC server is listening. The container will feed the display stream here. - I mounted several directories (which is the cache that I told you before) from another folder where my QGIS repo is located in my machine. This is just to keep things organized
- I mount my start up scripts
- I mount my python plugin inside the container (so I can run the python unittests)
If you are interested with my startup scripts, here it is:
       #!/usr/bin/env

# GDB Server must run inside the container as Host
# Then debugger client must connect to it

apt -y update; apt -y install gdbserver

pip3 install pydevd-pycharm~=201.8743.11
Basically I installed gdbserver and pydevd-pycharm package. These are packages needed for my debugging session. Gdbserver is used to debug C++ code, pydevd is used to debug my python code.
“Whoaa, wait, are you debugging both the python code and C++???”
Well yes, I don’t know what this is actually called (maybe mixed-mode debugging?), but it’s actually not that complex. The app run on a single thread and not distributed so we can block the process either from Python or C++, but in my case I need to attach breakpoints on both sides to inspect the values.
Mixed Mode Debugging with C++ and Python
Now, to start the debugging session, we just need to start the QGIS Debug container first.
In my repo, I provided simple make command to start the container.
       make up
# which is an alias for
# docker-compose up -d
This will start the gdbserver and if you view the container logs, it will show something like this:
       gdbserver: Error disabling address space randomization: Operation not permitted
Process /QGIS/build/output/bin/qgis created; pid = 356
Listening on port 34567
Gdbserver now ready to accept debug session. Next, I will start the session from within VSCode that opens my QGIS repo. I created a launch.json file for that.
In your project repo/vscode workspace, create the .vscode directory. Inside it, put the launch.json configuration, like this:
       {
	// Use IntelliSense to learn about possible attributes.
	// Hover to view descriptions of existing attributes.
	// For more information, visit: https://go.microsoft.com/fwlink/?linkid=830387
	"version": "0.2.0",
	"configurations": [
		{
			"name": "QGIS C++ Debug Launch",
			"type": "cppdbg",
			"request": "launch",
			"program": "${workspaceRoot}/build/output/bin/qgis",
			"miDebuggerPath": "/usr/bin/gdb",
			"miDebuggerServerAddress": "localhost:34567",
			"args": [],
			"stopAtEntry": false,
			"cwd": "${workspaceRoot}",
			"sourceFileMap": {
				"/QGIS": "${workspaceRoot}",
				"/usr/include": "${workspaceRoot}/build/include"
			},
			"environment": [],
			"externalConsole": true,
			"linux": {
				"MIMode": "gdb"
			},
			"osx": {
				"MIMode": "gdb"
			},
			"windows": {
				"MIMode": "gdb"
			}
		}
	]
}
If you are not familiar with VSCode launch.json file, I will explain a bit. This file is needed for VSCode to understand what kind of debugging session you want to make. In my case here, I am using type: cppdbg config. The full option can be seen in: https://code.visualstudio.com/docs/cpp/launch-json-reference .
Some options for highlight is the miDebuggerPath which must point to your gdb executable in the host, miDebuggerServerAddress which points to the debug server address, which in turns come from our QGIS Debug container port that we exposed to our host in port 34567. The sourceFileMap is used to map files inside the container to the very same files inside my project repo in the host. Notice that I also map the header files.
After this file is ready you can go to the VSCode debug menu and start the session. Usually by pressing F5, or clicking Run > Start Debugging menu. The Debug console will appear. If you also setup VNC connections, QGIS UI can also be seen. Here’s what it looks like:
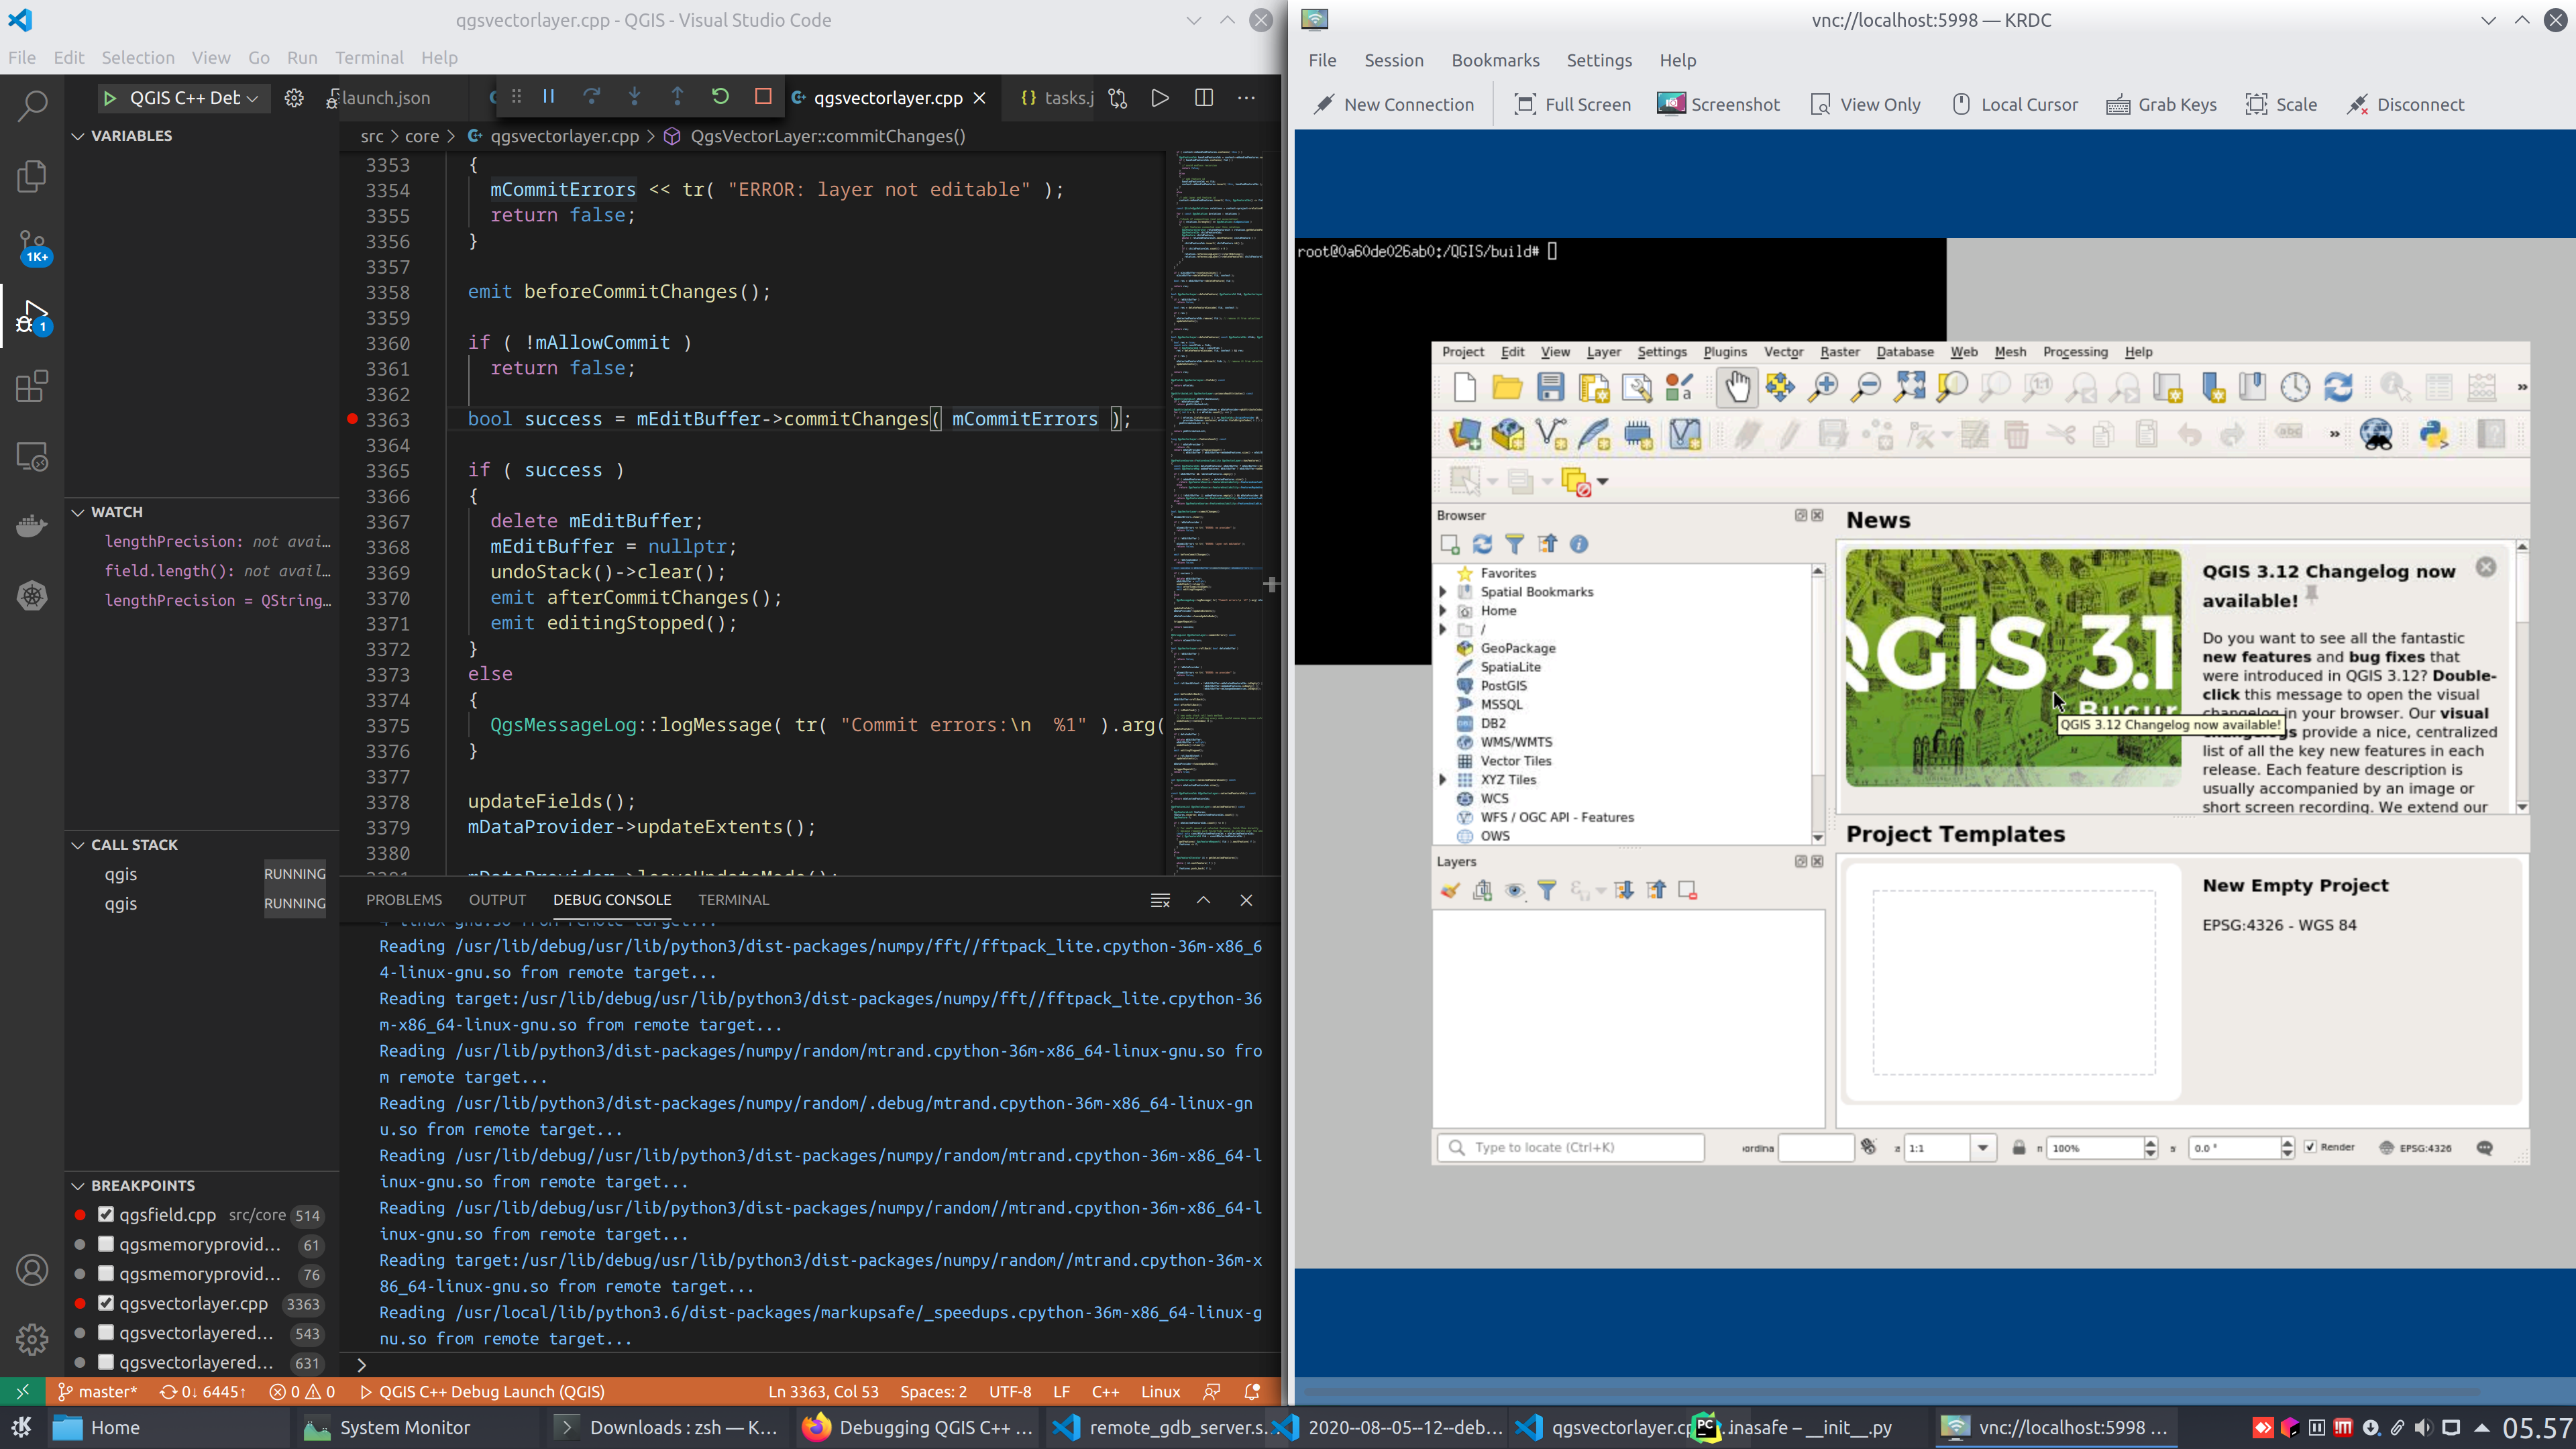
If you don’t know how to receive VNC stream, you need to get a VNC client first. I used KRDC, KDE’s distro packaged Remote Desktop Client. Create a new connection by putting this settings:
- Protocol: VNC
- Server address: localhost (since we are exposing the port from container to our host directly)
- Server port: 5998 (which is port 5900 + Display Number 98)
- User: root (hardcoded in entrypoint script)
- Password: userpass (hardcoded in entrypoint script)
The VNC part is not necessary, but a nice thing to have when you want to click thru things or viewing the GUI when running unittests.
One other thing to watch out for is checking if the debug symbols are properly loaded. If it is, the breakpoints will glow red as in the screenshots. If not, then VSCode can’t find the symbols.
You can start the debug session in C++ now, but for me I needed to fire up python unittests, because my unittests are in Python.
To do that, I open my trusty Python IDE (which is PyCharm… sorry VSCode).
I created a Python Debug Server Configuration as seen in the screenshot below:
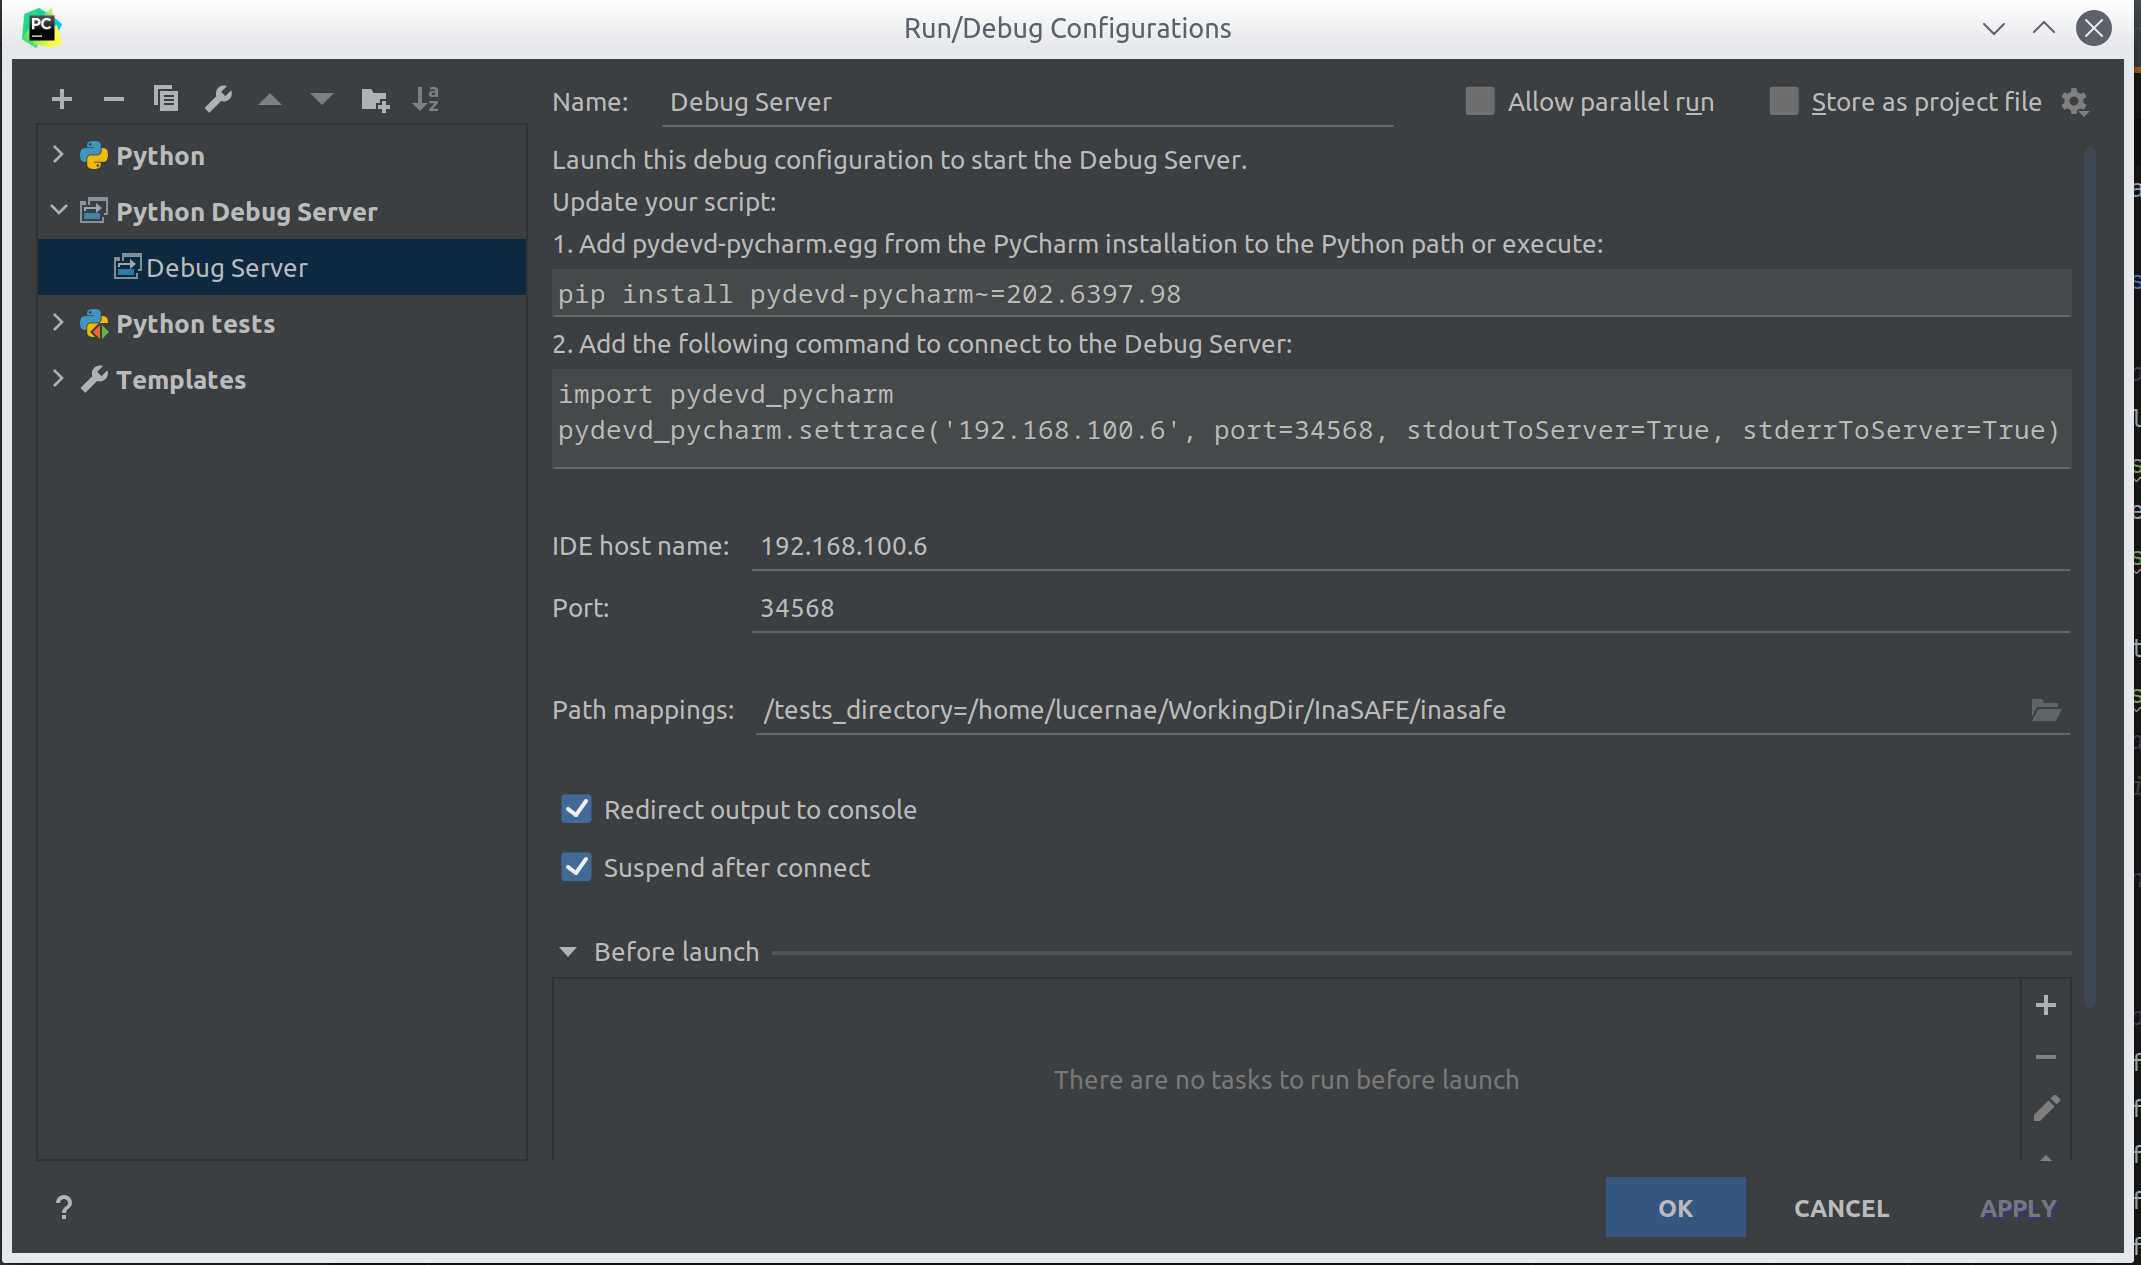
In a nut shell, I want to start a debug server. However, contrary with how gdbserver works, the debug server will be running in my host, by PyCharm. This is why I put my ethernet interface IP address in the IDE hostname field. You can’t use localhost because from the process inside the container, localhost is the container itself, so you won’t connect. You have to put the address where your host really is, which is the interface address from the container perspectives. If you are still confused, perceive the container as a separate computer somewhere that is connected with your LAN or WiFi. In that case, obviously you need to put your real host IP address for the container to be able to reach you.
Next, run the debug server. PyCharm will open debug console with some instructions on how to attach the debugger in your code.
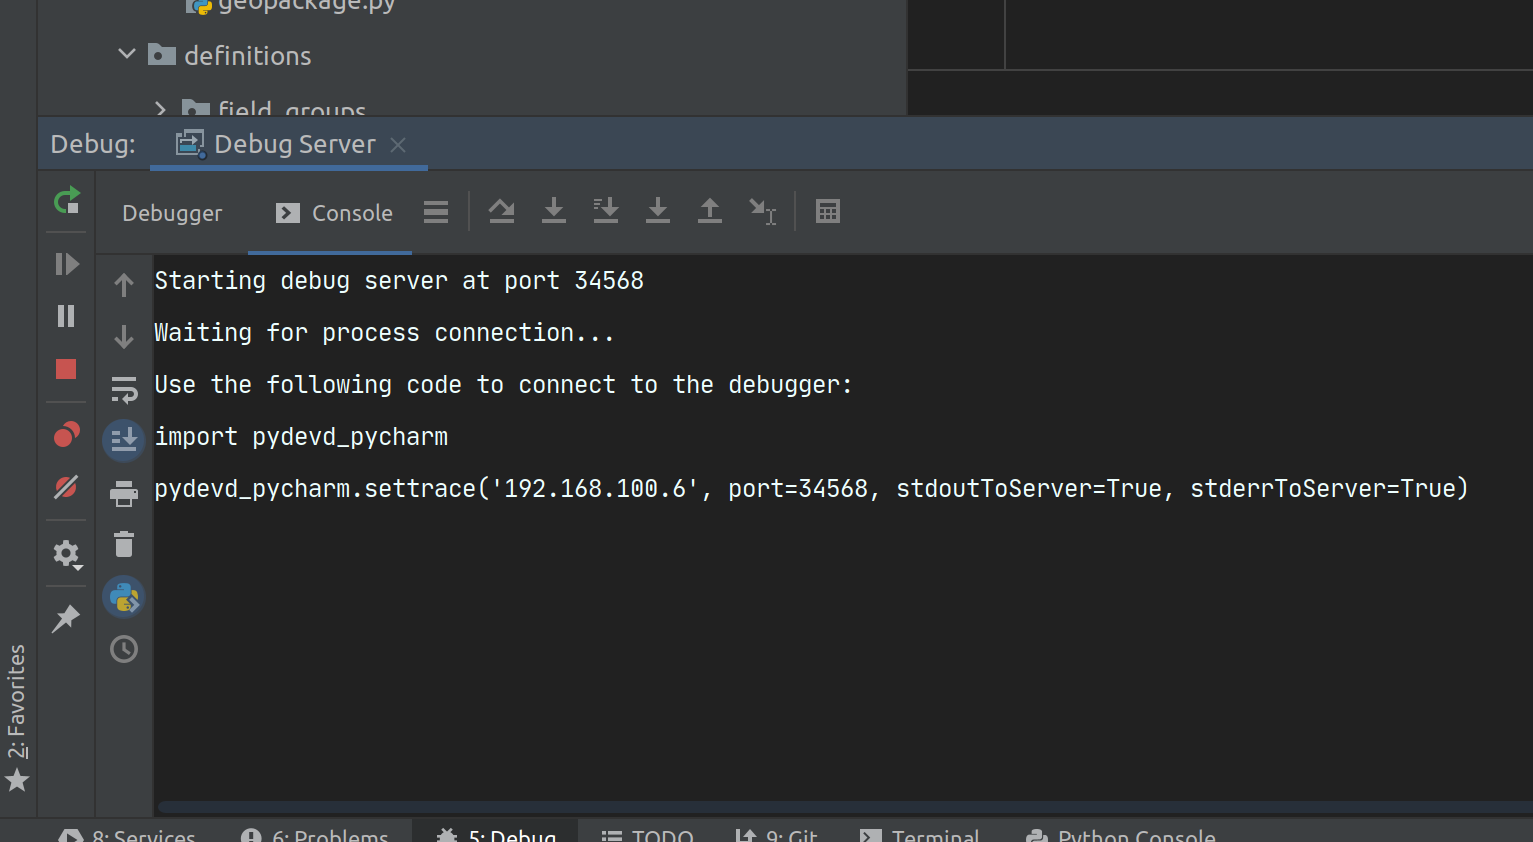
Follow the instructions. In my case, I copy paste the code and put it in my plugins entrypoint, which is __init__.py of my main module. Like this:
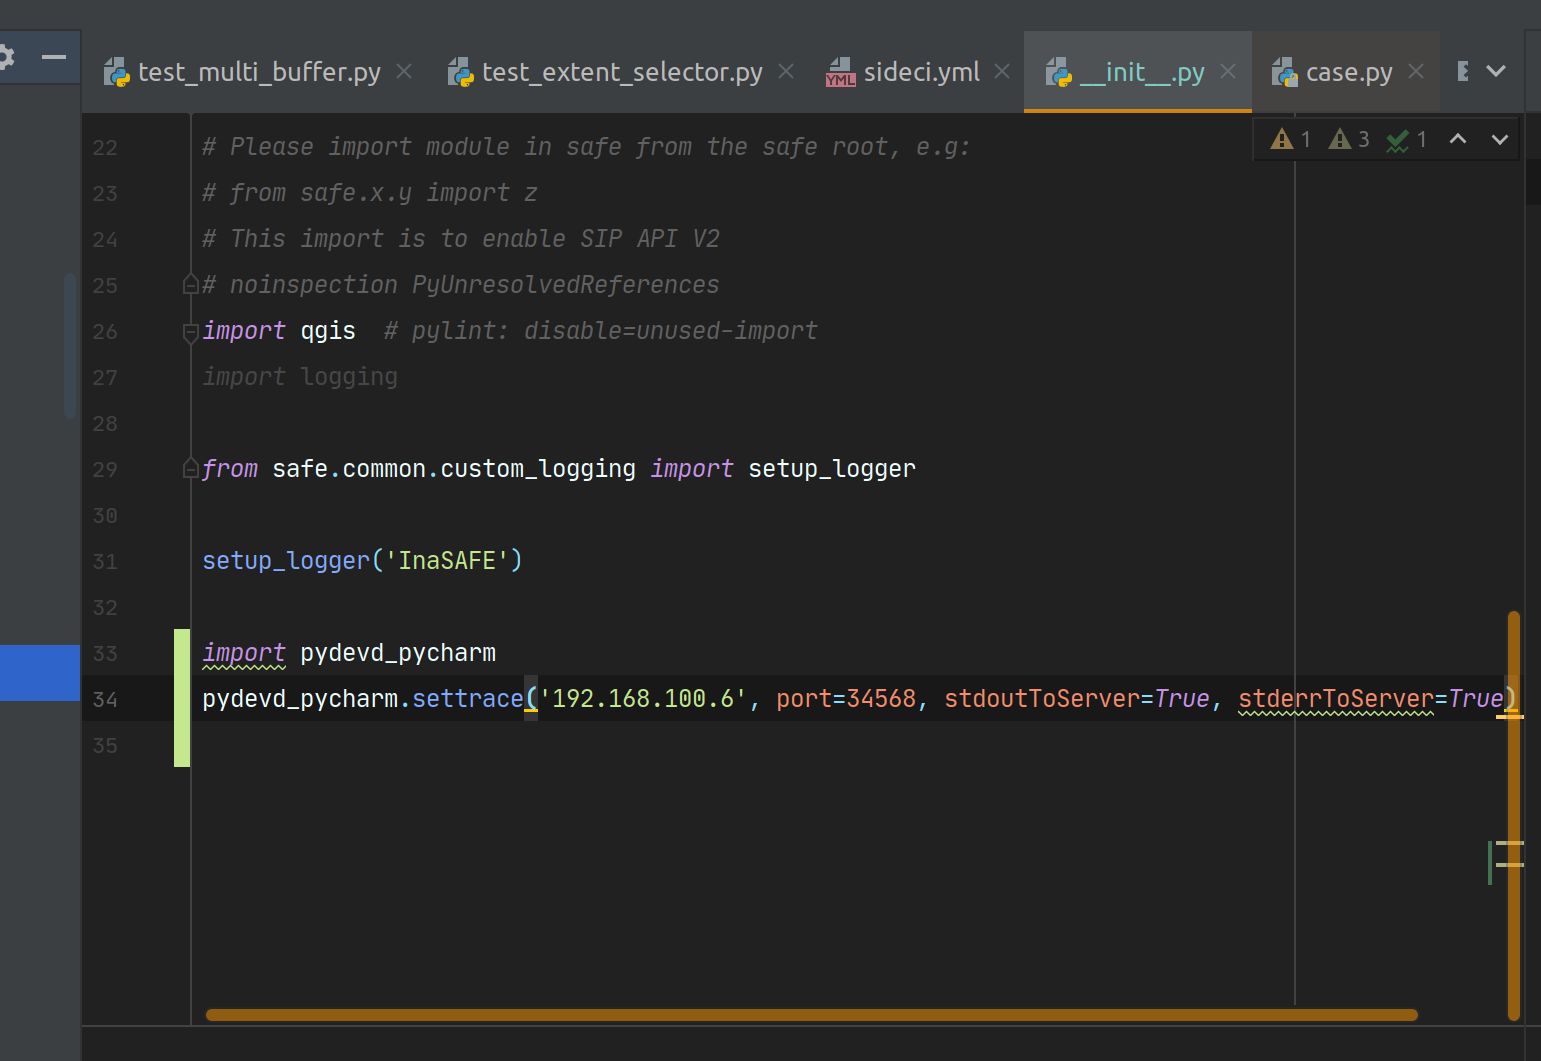
Ok. My setup is ready now.
We just need to run the unittest.
My unittest is a python code, so how do we start it by keep making it attached with the C++ debug session?
It’s easier than I think. I just need to tell gdbserver to watch out the process name I want to debug.
QGIS provides a bash script to run python unittests using QGIS python shell. So I just run that. In my case I run it like this
       # From inside the container
qgis_testrunner.sh test_suite.test_one
# The argument is my package name
What I want to see is how it actually calls qgis. After I run that, the program paused because PyCharm paused it (the debug attach works). I have time to figure out the process arguments.
       # The previous command will hang for now, so we open another shell session
# In this shell, try to figure out the PID of qgis
# Then find it from ps -ax output
# Then pipe it to less to view the full args
ps -ax | grep `pidof qgis` | less

# I got this following full command:
qgis --version-migration --nologo --code /usr/bin/qgis_testrunner.py test_suite.test_one
The debug setup that I know will work is to put this command as the program I want to debug. So I changed gdbserver argument to become like this:
gdbserver 0.0.0.0:34567 /QGIS/build/output/bin/qgis --version-migration --nologo --code /usr/bin/qgis_testrunner.py test_suite.test_one
Noticed that I replaces qgis with /QGIS/build/output/bin/qgis because that is my debug executable.
For convenience I put this as a command in my docker-compose.override.yml. Then restart the containers. Gdbserver will exit after each debug session, this command made the debug server restart after each debug session.
       services:
  qgis:
    command: /bin/bash -c "while [ 'TRUE' ]; do gdbserver 0.0.0.0:34567 /QGIS/build/output/bin/qgis --version-migration --nologo --code /usr/bin/qgis_testrunner.py test_suite.test_one; done"
I restart my debug session.
As a recap, this is what happens in order:
- When you restart your container, gdbserver start and waiting for gdbclient to connect
- When you run C++ debug mode in VSCode, it will start to connect to gdbserver start the session
- Gdbserver will run the unittest. It will pause because python debugger is attached in PyCharm
- I disabled all my C++ breakpoints, because I only want to step thru C++ code in the area where the unittest will fails
- I step into the python code in PyCharm and paused just before it is ready to run python wrapper that calls C++ code that will crash QGIS
- I enabled my C++ breakpoints
- I let the python code runs in PyCharm
- I am paused in VSCode because it hits breakpoints
- Now I step thru C++ code until I found the problem
- Rinse and repeat for the next bug
It is a little bit crazy that you jump from PyCharm to VSCode, but I really like PyCharm Pro features even though you can also use VSCode to run Python Debugger.
Long story short, I found the problem and fix it.
Useful tips to print Qt object values
As QGIS uses Qt framework, I was forced to watch Qt variables. One of the annoying things for me is I wouldn’t be able to see QString text in VSCode debugger because it can’t read the data structure.
I found a useful gdb command to do that in this article:
       # Taken from http://silmor.de/qtstuff.printqstring.php

define printqs5static
  set $d=$arg0.d
  printf "(Qt5 QString)0x%x length=%i: \"",&$arg0,$d->size
  set $i=0
  set $ca=(const ushort*)(((const char*)$d)+$d->offset)
  while $i < $d->size
    set $c=$ca[$i++]
    if $c < 32 || $c > 127
      printf "\\u%04x", $c
    else
      printf "%c" , (char)$c
    end
  end
  printf "\"\n"
end

define printqs5dynamic
  set $d=(QStringData*)$arg0.d
  printf "(Qt5 QString)0x%x length=%i: \"",&$arg0,$d->size
  set $i=0
  while $i < $d->size
    set $c=$d->data()[$i++]
    if $c < 32 || $c > 127
      printf "\\u%04x", $c
    else
      printf "%c" , (char)$c
    end
  end
  printf "\"\n"
end
You can copy paste that and put it into ~/.gdbinit. This will allow you to access this command inside gdb session. I use it like this in VSCode:
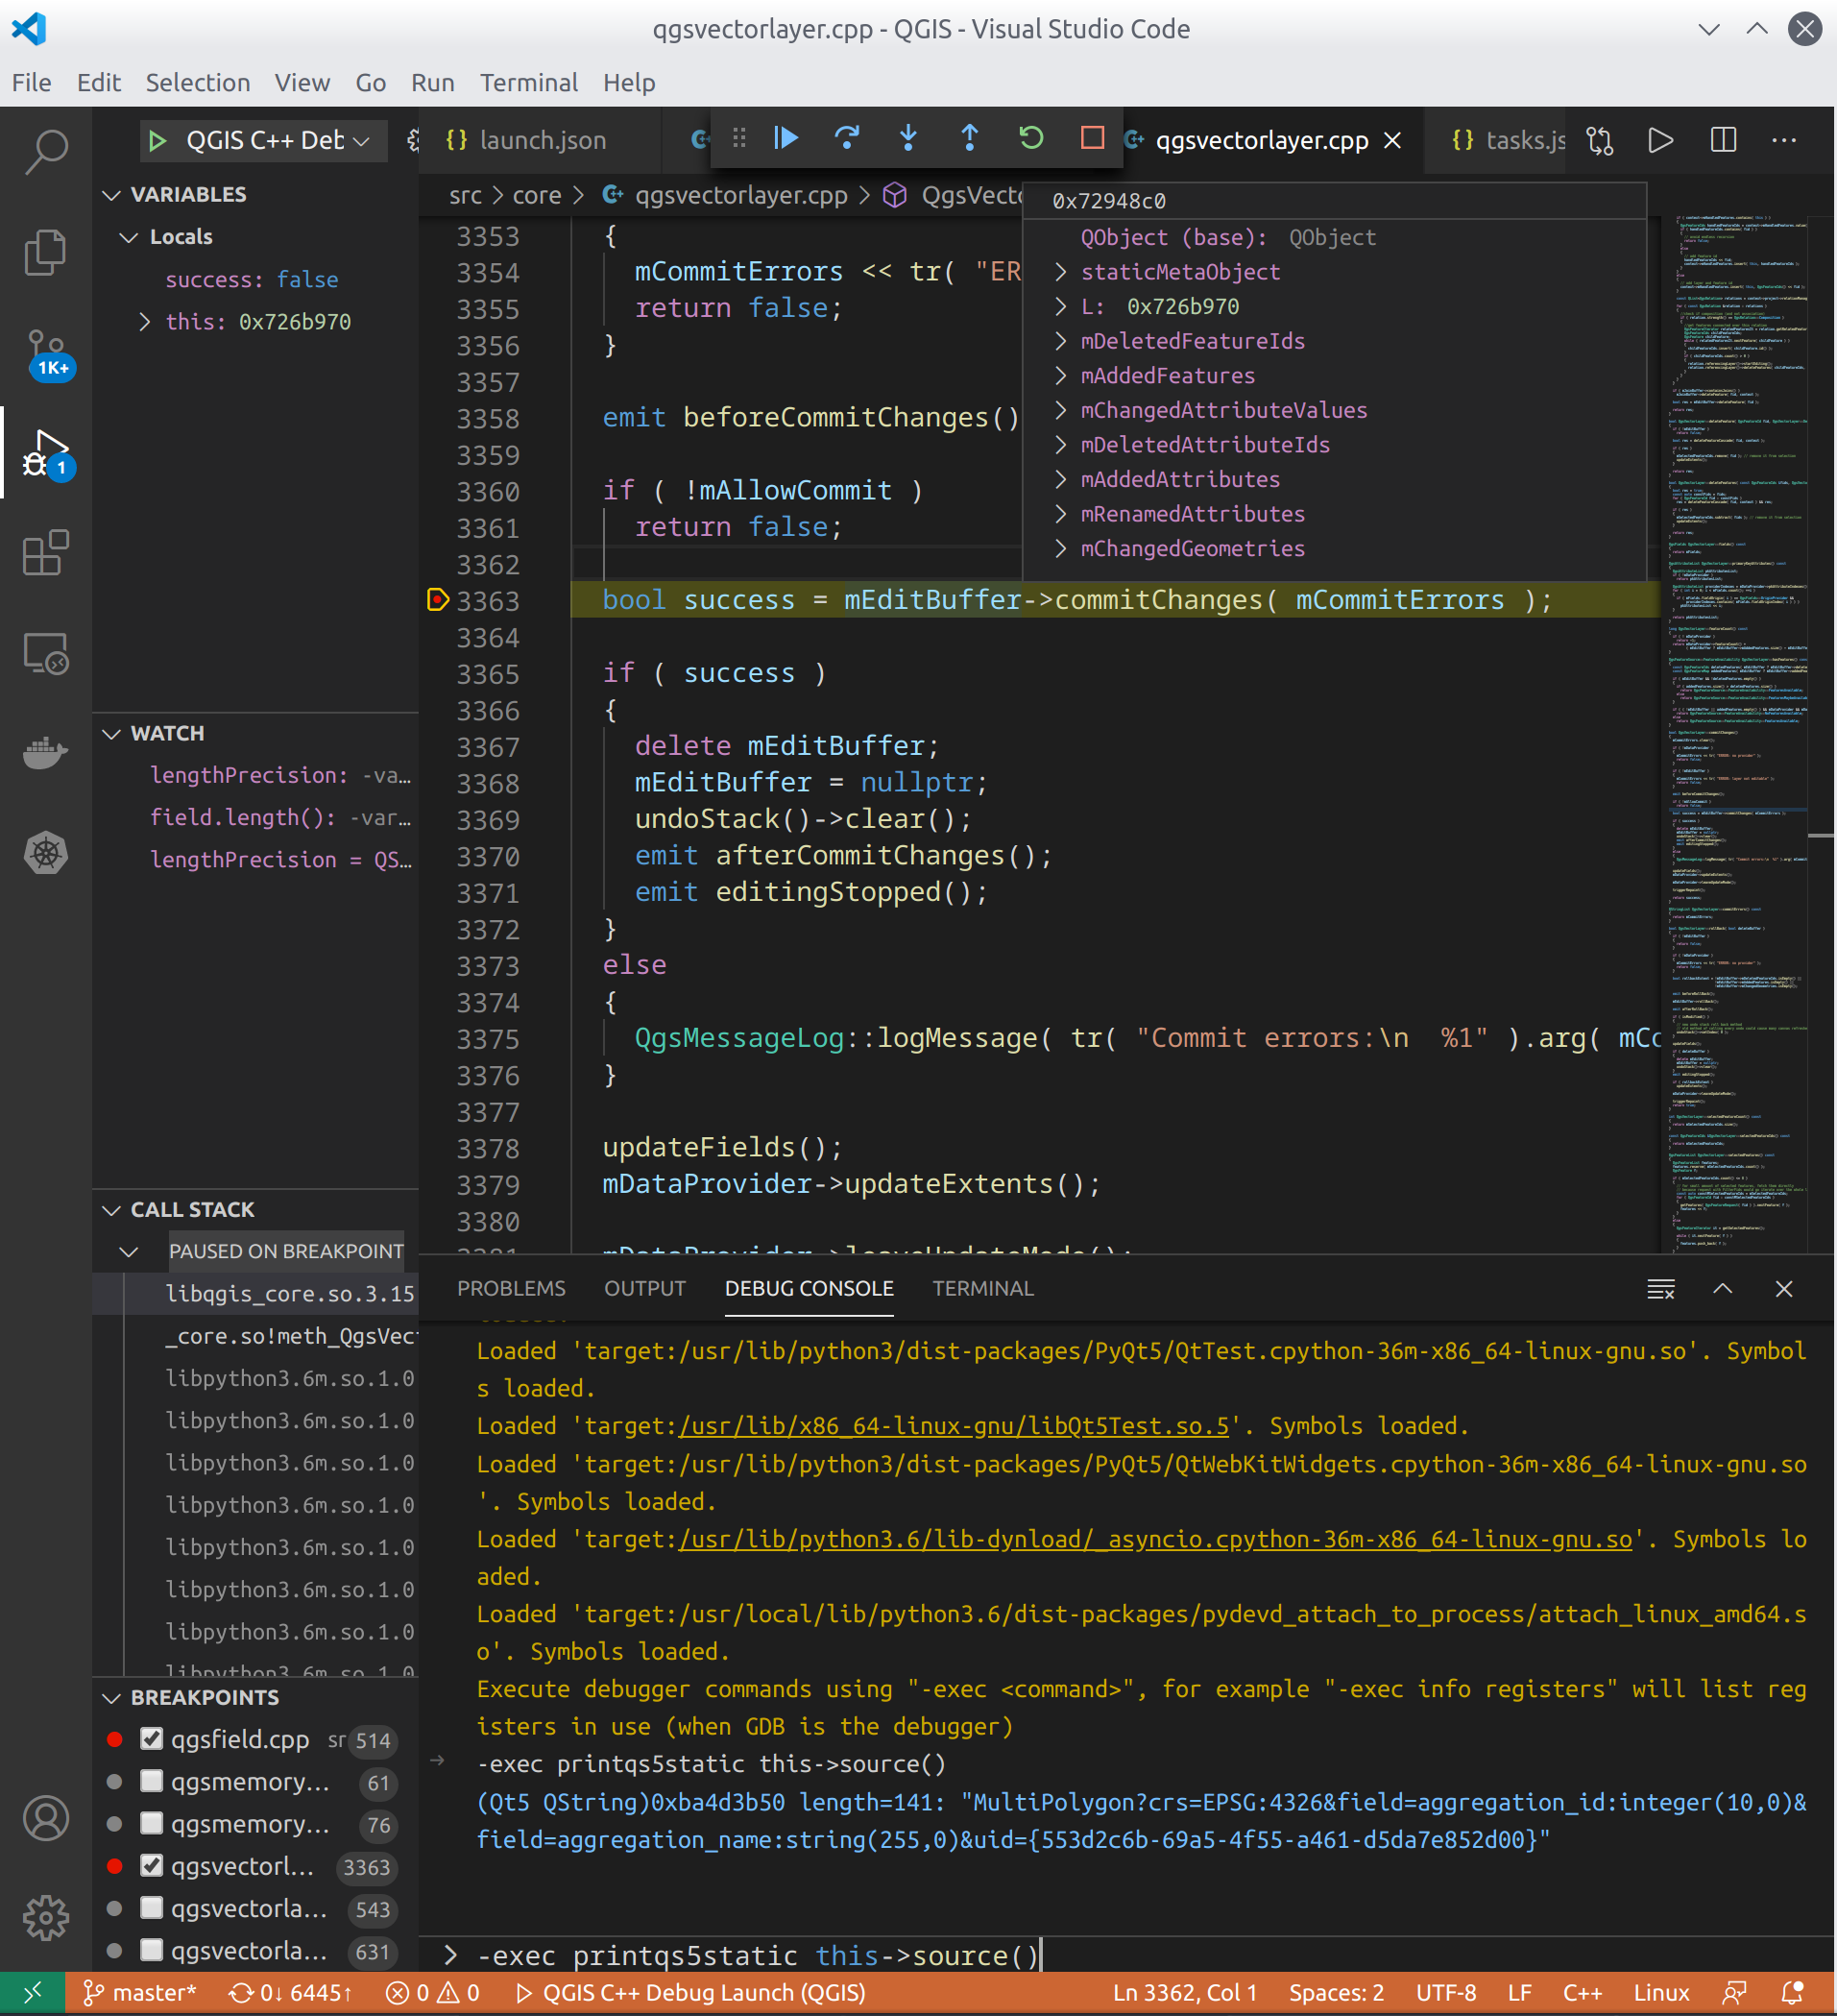
In the debug console, I run -exec printqt5static <variable name>
Special thanks for http://silmor.de/qtstuff.printqstring.php for the neat macro.
Conclusions
It is such a rare occasion that I need to go deep and cross from Python realm into internal C++ code structure of QGIS. I mostly deals with PyQGIS code anyway. I am also not assigned on any QGIS core code related tasks. However this kind of setup works with any reasonable C++ development. It’s not unthinkable that you need to do a remote debugging session from inside container. Especially for project that have huge native dependencies like QGIS. With this setup, people like me, that is not a daily contributor of QGIS can easily focus on tracing the code instead of dealing with dependencies issues in my daily driver computer that is not properly equipped to do that kind of tasks. Let docker hub build the debug version of the app and you can just use it right away.